Board member Denton Bramwell is a physicist who makes his living at statistical manufacturing and quality control. He told me that a sample size of 30 was a common standard before Fisher wrote the details of his analysis of variance (ANOVA) in 1925 and came up with the z-distribution and other tools. Afterward a lot changed. Denton said feels he gets enough information from a sample size of 15 at this point in time, given the tools available to work with it.
What a 30 sample group will do is give you a visual appearance of both sides of a bell curve, so it invokes more confidence in how well the mean estimates the mean of a very large population.
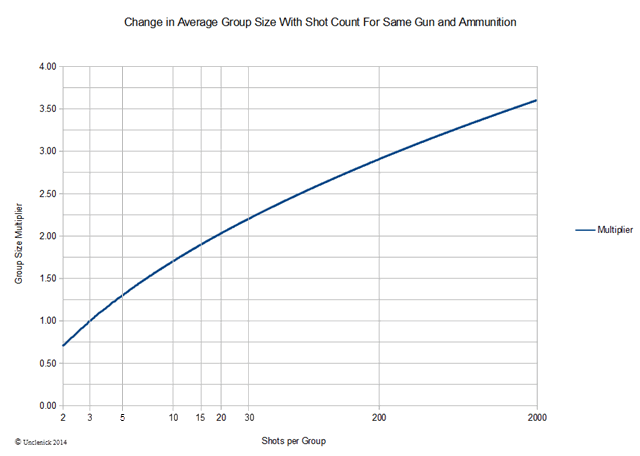
The problem with group size is, the larger the sample, the larger the group. So when you say how many MOA your gun can group into, if you don't also say how many shots it will group into that number of MOA, the statistic is meaningless. Groups get bigger because a larger random sample increases the number of chances lower probability points of impact have to occur. I have a plot of that below, using an average 3-shot group size of 1.00. 1.00 "what" doesn't matter—moa or inches at a particular range, or whatever. A real statistician may come by and find fault with it because of an assumptions I made, but the shape of the curve will be about right. It shows an 18 shot random group being twice the size of a three shot group. But watch out on that score, because it is the
average 18 shot group that will be twice as big as the
average 3-shot group. Individual groups can vary quite a bit. Especially the 3-shot ones.
Note that the sample size scale (x axis) is logarithmic because as the sample size get larger you are asking more and more rare events to add to group size and the bell curves tails accelerate rareness exponentially with sample size. 18 shots may double the average size 3-shot group, but, tripling it requires about 300 shot averages.
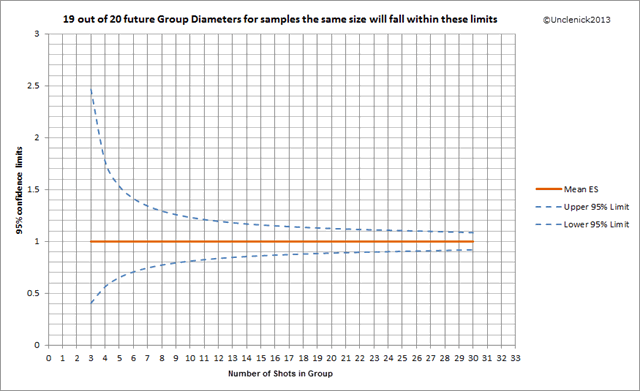
In general, a single 3-shot group indicates the next 19 out of 20 shots (95% confidence) will be somewhere within 2.5 times bigger and 60% smaller than your current group. For a 15-shot group its about ±15%. For a 30-shot group it's about ±10%. If other groups tend to all be the same size and not change that much, the source of error may not be truly random, but a bias of some kind. That can easily make the distribution non-normal so everything in my plot above then becomes invalid until you account for the bias. If a group is truly random, as ammunition test groups from machine rest barrels tend to be, only then does that plot hold.

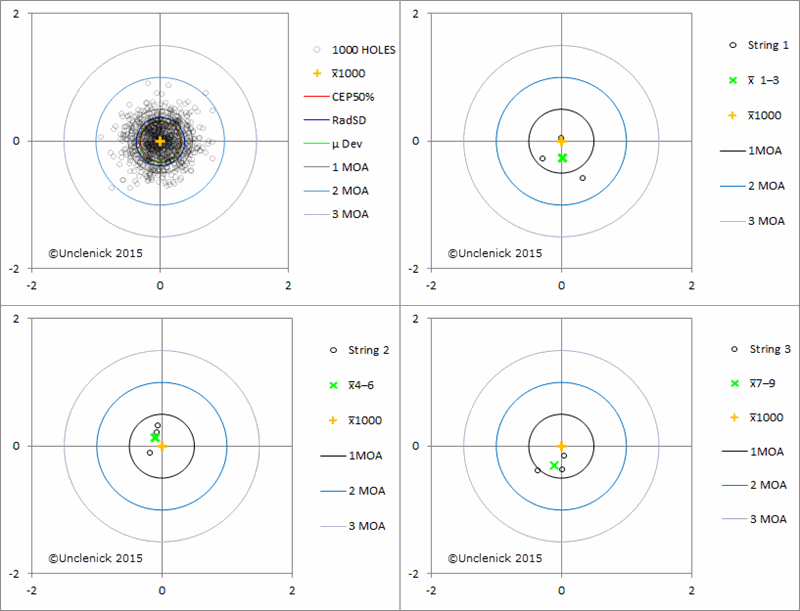
Below is a computer generated 1000 shot 2 moa group together with three targets showing the first three, second three, and third three shots of the 1000. A fellow firing three, 3-shot groups like that from a gun could be forgiven for thinking he has a sub-moa rifle. And he does most of the time he fires three shot groups, even though the gun would be 2 moa with 1000 shots. And human nature being what it is, if the fellow gets a 3-shot group that includes some of the more rare holes further from the center, he'll assume he did something wrong because that's not how he believes the gun shoots. Well, it is how it shoots. Just not most of the time.

Another thing to notice is the green X's that are the center of each 3-shot group. See how they wander around. The yellow cross is the center when all 1000 shots are included, so it's a good estimate of where an infinitely large sample would be centered, and since you never know which one of the future possible shots is coming up next, the yellow cross is where you want your scope zeroed for the best odds of hitting what you shoot at. But can you find that yellow cross from the three green X's? Not really. You get closer if you combine all nine shots, though it's still going to be low and slightly left. But the more shots you include the closer you tend to get, randomly. You could shoot a couple more 3-shot groups, and there's a chance they'll be high and right and tend to pull the center in a little better.
That moving around of the center of the the center is evaluated by a statistic called the standard error. It is the standard deviation of the standard deviation among multiple 3-shot groups. It tells you how much the mean will vary around the center, as if each group center represented a single combined bullet hole. It is equal to the population standard deviation divided by the square root of the sample size, so it's a number that gets smaller with group size, but shrinks slowly as group size grows, just like the growth in group size got slower as sample size went up in the first graph. 12-shot groups will wander around half as much as 3-shot groups do because the square root of 12 is twice the square root of 3. Your 30-shot groups, on average, will have their centers wander around 3.16 times less than the 3-shot groups do. So this is a measure of how well your group represents the perfect mean value of a theoretical infinitely large number of shots.
There are different strategies for getting a group size number that doesn't tend to change as much with sample size. Such strategies simply discount the influence of the outer-most shots with their lower probability. One commonly used by the military is the mean radius, but in test specifications a particular number of shots is given for it to be good with, as it will grow some with sample size; just not as much as group size does.
The method that should theoretically transcend sample size is the radial standard deviation, but the transcendence is limited by how well it you can estimate population mean and standard deviation from your sample size. Remember, standard deviation taken from a sample is always an estimate of the standard deviation for the whole population of shots ever to be fired in that rifle. The limitations are that real guns wear, so their precision changes over time, and more importantly, small sample sizes doesn't give you a very good estimates if what some theoretical infinitely large population would be like. Which of the those three shot groups I put up in the second image would you try to make these infinite group mean and SD estimates from?
So, if you use small samples you really have to use strategies for determining standard deviation that are more realistic than the usual sample standard deviation calculation can make with small values. Student's T-distribution can be used to get the standard error influence included. Square root bias compensation for small samples has to be used, and so on. Even with those enhancements, you'll want to use several small groups and not just one.
The bottom line is that there is no such thing as an X-moa rifle without a shot count specification. You just have a rifle that averages X moa for Y shots, or Q moa for R shots, etc. If you can accurately estimate radial standard deviation you will have a number that theoretically remains constant regardless of group size, but it depends on the quality of the estimate.
Again, I'm not a real statistician and someone who is should be better able to address the tools I mentioned and whether or not I'm even citing them entirely correctly. I just started from one basic statistics class in college, and then did a bit of further reading. So, caveat emptor, but this is what is happening as far as I can tell.


