Bongo Boy,
These are measurements made with a strain gauge datalogging instrument. The resolution is only 8 bits, so with the 50,000 psi scale, the resolution jumps in 195 psi increments.
Strain is how much something bends or deflects in response to the stress of an applied force. The strain gauge used here is the most common type that is a zig-zag pattern of an electrically resistive foil sandwiched between two thin insulating film layers. You glue them to things you want to measure strain on, and wires run from the ends of the foil to form an arm of a resistance measuring bridge. After gluing these gauges to something, when that something stretches or compresses, the gauge stretches or compresses with it, causing its resistance to go up or down. By measuring that resistance change, and knowing the bending properties of the material it is attached to, you learn how much the something was strained (deformed) by the stress force applied to it.
On metal, strain gauge measurements are extremely linear, out to many decimal places, just so long as the metal is strained within its elastic limits. This is how laboratory scale load cells are made; by gluing strain gauges to small metal beams that the scale pan sits on. In effect, the metal beams are a spring and the gauge changes resistance in proportion to how much that spring is bent by the weight on it. On the outside of a rifle chamber, the gauge changes resistance in proportion to how much the steel expands underneath it due to the pressure inside. This is a quick event, but the traces in the images are showing that resistance change and what pressure would produce the amount of stress that results in the amount of strain that the changing gauge resistance shows.
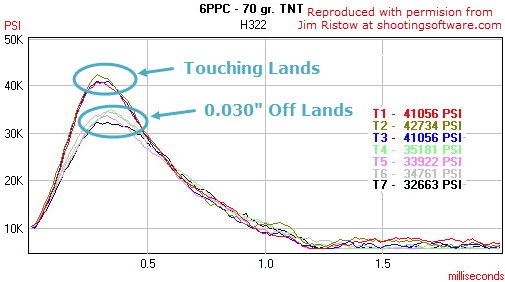
T1 is test one, T2 is test two, etc. Each of the tests is a different shot. Across the bottom of the scale is the time starting from the trigger pressure set on the test instrument. The vertical left scale is the corresponding pressure based on the thickness of the steel wall of the chamber under the gauge. Each peak pressure labeled T(
n) corresponds to the round that produced the pressure plot that is the same color as the lettering.
In the plot I made of the .30-06 in my dad's '03, T1 had the cable connector come loose during the measurement, so the measurement just showed a lot contact make and break garbage, so I removed it. That's why that graph starts with T2.
Mr. Guffey,
Below may be a plot that will interest you. It shows three pressure traces from three rounds fired touching the lands, T1, T2, and T3, and then four pressure traces of the same load with the bullet seated 0.030" deeper, T3, T4, T5, and T6. You can see the pressure peaks are about 20% lower for the last four rounds. In this instance, the measurement timer starts when the strain corresponds to 10,000 psi. At just past the 1.0 millisecond point beyond that, the bullet has cleared the muzzle. It then takes just a fraction of a millisecond longer for the drop in pressure to reach the chamber and the reading to drop zero. The fact the reading is slightly above zero, as many are, is some sort of direct current offset or drift, caused either by a capacitor taking a charge, or by glue recovery hysteresis in the gauge interface surface. I don't know which.

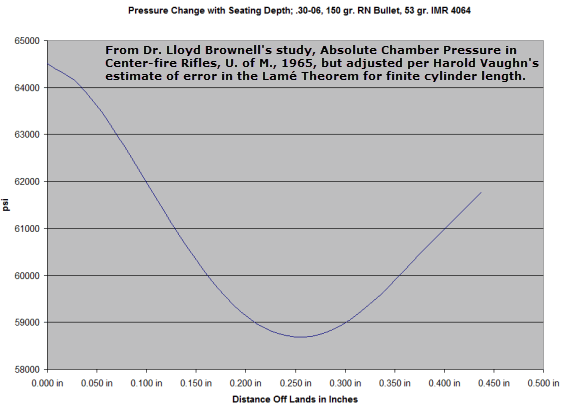
In 1965, Dr. Lloyd Brownell ran the same experiment, also using strain gauges. The plot below is of how the peak pressure changed as he went from touching the lands to seating very deeply. It's interesting for a couple of reasons. One is that there is a pressure minimum, below which seating even deeper raises pressure again. The other is that the drop in pressure is continuous as you come off the lands, and not a sudden jump. Brownell's explanation was not the usual static vs. kinetic coefficient of friction one you hear which is based on the assumption there is a more sudden change in pressure from touching the lands. Instead he suggests that after the neck expands to release the bullet and before the bullet can reach the throat, there is gas bypassing it, and that stops the pressure from building as much before the bullet is running away from the chamber, expanding the burning space. That running start then prevents the remaining powder from reach as high a peak. This plot of peak pressure vs. seating depth is for a round nose bullet in .30-06. A round nose has to move further than a Spitzer nose does to make as big a gas bypass opening around the bullet. That's why the pressure change in the 6 mm plot above is more sudden for a shorter seating depth difference.

Nick


