A couple of things:
The 100 m groups change with precision, but as Bart said, it is hard to see a difference that is due to drop, alone. That is why Creighton Audette always used 200 yards, and why Randolf Constantine recommended taking that out to 300. The downside is that you need a big, bright objective on a high power rifle scope or a good spotting scope to keep track of which hole was made by which shot at that range. We who've shot Highpower almost all seem to have a nice bright Kowa spotting scope somewhere among our gear. If you don't have that, the longer ranges are harder to shoot an Audette Ladder with.
The OCW is a little different. You don't put all the shots on the same target as you do an Audette ladder, so keeping track of the individual shot holes can be skipped unless you are looking for heat walking or fouling shifting POI or some other trend that requires noting each hole's individual location. It's true that a 300 m target is a little harder to see, but that's what Newberry uses most of the time, so I think he's found an advantage in the extra drop easier to see, too. However, you can still find non-drop dispersions at 100 m. It just takes more effort.
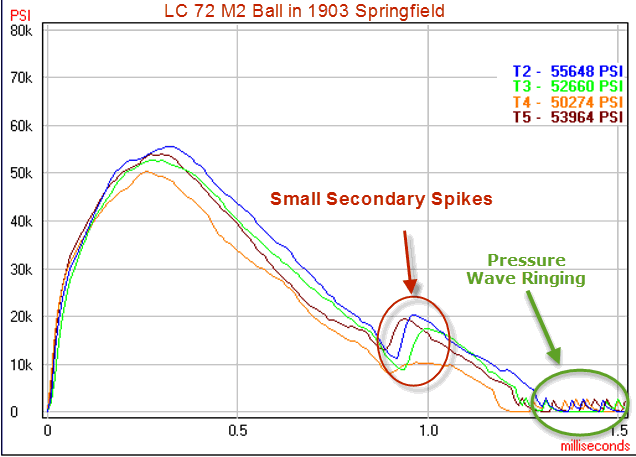
The pressure wave concept is an interesting theory, but the OCW working or not working doesn't depend on it. It only depends on the groups you get. The OBT theory just tries to suggest where you might find such sweet spots. Dr. Lloyd Brownell actually noted the existence of the pressure waves on his strain gauge readings back in the 60's. He believed they were initiated by the impact of the bullet jump to the throat, which slows it down and lets pressure build before it is fully engraved and accelerating again. These waves are
fast, but not large, and you can see them in the pressure measurement I made, below. You only see them clearly after the rest of the pressure has dropped, and there the negative half of the ring is missing here because the Pressure trace doesn't register below zero signals. The pressure wave excursions are mixed with the pressure curve starting from where it is around 30,000 psi and up in this plot. They are what cause the curve to be lumpy and rippled rather than smooth, like a QuickLOAD plot. Before 30,000 psi, the rising curves are smooth, but 30.000 was where the bullets were slamming into the throat. For most cartridges the ripples start at more like 12,000 psi, but the M2 ball used here has age-related high bullet pull, so the start pressure is high, too.

If Brownell's theory of creation of the pressure wave is correct, a bullet seated out to touch the lands should not create a pressure wave. I have not made the comparison in that same rifle to see. It's something to put on my bucket list. It would suggest Mid Tompkins, who always soft seats, doesn't have to concern himself with pressure wave effect.
Whenever you have the problem of telling one group average from another, you can apply what is called
Student's t-test. It will tell you whether or not two averages are different to a specified degree of confidence, or if they fail to show their difference is more than just random to that same degree of confidence. Conversely, you can use the t-distribution to tell you how much confidence you may have that two averages are actually different and not just randomly different. This gets you around eyeballing the statistical significance of the difference by putting an actual number to it. You may or may not be interested in this, but Excel's data analysis package includes a t-test generator you can use by activating the ranges of data you mean to examine and telling it what confidence level you want to test.
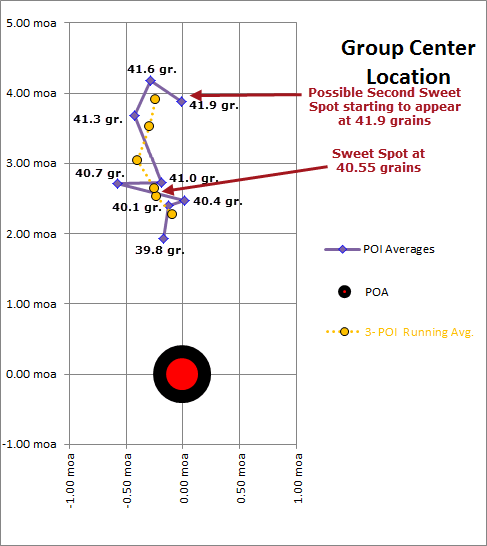
The 100 m groups do just fine at identifying spread due to something other than drop, such as barrel vibration. However, the 3-5 shot bulls by themselves have too few samples to make the difference clear. This is partly described to a statistic called the standard error, which tells you how much to expect the group centers to move around from one group to the next. You find it by dividing the standard deviation of each shot radius from the center by the square root of the number of shots in the sample. Mathematically, it is the group-to-group standard deviation of the standard deviation of individual shots. Why it matters is shown in a graph of bullet vertical position from one of James's previous groups.
The graph tells you the same thing about barrel vibration an Audette ladder does, but does it at 100 m and does it for both horizontal and vertical at the same time (the OCW advantage over the Audette ladder). Note that the purple diamonds are the centers of his 3-shot groups, and if you looked just at their locations and at the similar sizes of the groups (not shown here), you'd have no clear clue as to where a ladder sweet spot might be. But when you look at the yellow circles, it is very clear which two are closest together, both horizontally and vertically, as the charge weight increases, and are therefore where the Audette vertical sweet spot is.
Those yellow circles are what are called running averages. Each one represents 9 shots. The first combines the first 3 3-shot groups 1, 2, and 3. The next combines 2, 3, and 4. And the next combines 3, 4, and 5, etc. Each time you create a point, you dump the first 3-shot group and add the next one to make the next 9-shot data point.
By combining the group centers that way, you get a larger, 9-shot sample for each data point, but most important here is you get a standard error about 5 times smaller. This is because you not only have the overall standard error smaller by a factor of 1.7, because of using 9-shot groups instead of 3-shot groups, but because two of the 3-shot groups making up each 9-shot group were also part of the previous group, you are only changing a third of the holes that influence the position of the center at one time. That reduces the average change between 9-shot groups by another factor of 3. The result is the mean position jitter is much reduced, leaving the average change in position much more evident. In this case, it's any charge from 40.1 to 41.0 grains that is within the sweet spot range, and the horizontal shift from 40.4 to 40.7 grains is almost certainly just random. If James sets his measure to average 40.55 for this load combination, he had a range of ±0.45 grains he can err without seeing his groups grow appreciably.

James, I'll recommend a tool for you to help gather data for these kinds of analysis. It is a $12 piece of software called
OnTarget. There is a free version you can get (bottom of the page) to try it out, and you have to pay for the full feature version. In it, you import an image of your target. You want to have a rule included. You then calibrate the software with a little "Set Reference" tool that you click at each end of a known distance in the photo (the ruler graduations), then enter the real world difference in the little pop-up window that appears after the second click. You then tell it your bullet diameter and the range of the target and another tool lets you set your point of aim and place bullet-size circles over each hole. It then calculates the groups stats automatically. In the "tools" menu you can then export individual hole data to a csv file that Excel can read. You can then do all the stats you want on the hole positions, including the kind I did, above, in Excel.
If you don't like going the Excel root, the same company offers a more sophisticated program that you print targets from. When you scan those targets, it recognizes them and finds the hole centers and does all manner of common stats for you without you doing anything else. It also has the ability to virtually combine multiple groups into one. But this program costs a good bit more ($75).
Finally, on your chrongraph, it does sound like it was off. Most chronographs use consumer grade electronics that are out of spec below the freezing point (32 °F or 0 °C), so you can't use them when it's colder than that. Batteries also have more internal resistance in cold weather. If it was cool when you shot the groups, I would consider buying the Energizer lithium batteries for the instrument. They have much, much better power delivery at low temperatures than alkaline or carbon-zinc batteries do.
I would keep an optical chronograph at least 15 feet from the muzzle for rifle shooting. The screens can be tricked into false triggering by ejecta from the gun. If it were a heavy magnum I would go for 18 feet. An easy way to set one up is with a laser bore sighter. You take the bolt from the gun and put it on a piece of paper that says "
Remove Bore Sighter before putting me back". You set the gun up on bags so the sight stays on your target. Turn on the bore sighter, pace off the chronograph distance, then set the instrument up, holding your palm in the centers of the front and back screens, alternate, to find the laser and to adjust the chronograph mount so the screens stay centered that way. When you go back to the bench, a quick look through the scope will tell you where the rifle needs to point to shoot through the centers of the screens.
All the usual lighting condition warnings apply. Also, no light colored ground under the unit to cause bullet glints on a bright day (use a dark tarp if need be).


