More work with that FBI Spreadsheet this time on AWB and Shall/May Issue

Was able to find FLA and Alabama on state .gov pages. Alabama just gave a total, while FLA broke out firearms and various non firearms, but not type of firearm, i.e. Handgun/shotgun/rifle/unknown firearm. Getting those put in now.

The three missing states, FL, AL, and AR are in using their state reports. Also added the three restrictive law categories for AWB, May Issue, and Permit to Purchase. Here's the new link.

https://docs.google.com/file/d/0B0XDpTBLvfsFZU85MUV0eV8wSW8/edit?usp=sharing

Edit: If someone who knows how wants to download it, and add the standard deviation stuff talked about earlier, they can PM me for my email address and I'll put that version back up.
 
Last edited:
JimDandy said:
Edit: If someone who knows how wants to download it, and add the standard deviation stuff talked about earlier, they can PM me for my email address and I'll put that version back up.
I know how to use the Standard Deviation function -- I use it at work. But I have no idea how it can be used with respect to any of these data.

Standard deviation applies when you have a string of data points all measuring the same thing, and you want to see how much or how little variation there is within the string. Ammo chronograph readings are a perfect example. You shoot a string of ten or twenty rounds of the same ammo, and the chrony records each shot. It will then give you back the average velocity, the max and min velocities, the extreme spread, and the standard deviation.

The standard deviation is an indicator of how much or how little the overall string varies (deviates) from the average. Smaller standard deviation equates to better consistency.

To whoever proposed adding Standard Deviation here -- what do you want it applied to? There are no data here that are really susceptible to a standard deviation analysis.
 
I imagine they want a standard deviation for the gun homicides per 100,000 people.

If I get it workin right after that, I'll even try and sort it by several categories. I'll have to play with the category math at the bottom now that I've included permit to purchase in restrictive laws.

Edit I got the stuff from AR mostly. They didn't break things down quite the same as the fed, but three states were missing. Alabama, Arizona, and Florida. I checked their state websites and found at least a basic count of firearm homicides for each state allowing me to fill in that far.
 
Last edited:
JimDandy said:
. . . .The three missing states, FL, AL, and AR are in using their state reports. Also added the three restrictive law categories for AWB, May Issue, and Permit to Purchase. Here's the new link.

JimDandy said:
Edit I got the stuff from AR mostly. They didn't break things down quite the same as the fed, but three states were missing. Alabama, Arizona, and Florida. . . . .
Were or are you missing information from Arkansas (AR) or Arizona (AZ)? :confused:
 
Here's yet another revision...

https://docs.google.com/file/d/0B0XDpTBLvfsFNGZzaGxVSEZWTDA/edit?usp=sharing

This added three columns from the Wikipedia page for the three most common restrictive laws- FOID style permits to purchase, Assault Weapons Bans, and May Issue Carry laws.

If the law was on the books, but not enforced, or not statewide, I counted it. For example Denver has an AWB but Colorado does not. One of the states was noted as having May Issue permit laws that functioned as Shall Issue based on current enforcement.

This gave me some REALLY interesting results, and pointed out a REALLY interesting result I'd been missing so far.

In the TOTAL homicide column, the permissive states are higher. In the Firearm homicide column, the rates are lower. When you divide based on any restrictive laws in our list, the permissive states have a higher homicide count. Firearms homicides are exactly the same- AND the same as the national average- before any state is divided out for its laws.


Edit: Whoops, I didn't count Colorado...

ReEdit: Double Whoops. I did count them, they're Row 9 in the formulas. They just didn't get color coded.
 
Also adding the three missing states has swung the average over to the restrictive states on the previous breakdowns such that the restrictive states have lower rates. But I also see that has changed the formulas to the earlier stuff, and I have to fix it, so wait for hte next upload and link.
 
While I was waiting, I did the same with 2010 data... link is https://docs.google.com/file/d/0B0XDpTBLvfsFQ2h6MTJSc2wwWk0/edit?usp=sharing

One PDF is the basic form. The other two, I pulled out the Permissive vs Restrictive totals, and sorted the whole sheet on firearms homicide rate.

The "bad" half (25 of 51) had 10 of the 18 restrictive jurisdictions. 6 of the top 10 on the bad half were permissive. Flipped and sorted the other way, 11 of the top 12 were permissive. None had extremely high populations. I'll be adding a population density column in the near future though. I eyeballed the page on the Census website with pop density, and just eyeballing, my gut says it'll be suggestive but not definitive.

Stronger correlations are geographical- states that were Confederate, or border states with Confederate leanings litter the top of the "Bad" list. States so far west they weren't even a state in 1860 dominate the "good" list.
 

Attachments

Last edited:
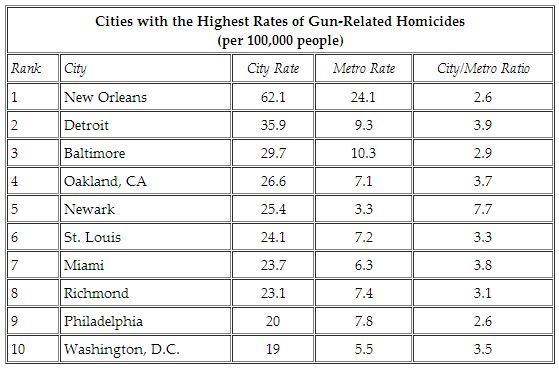
Jim, this is great stuff. It's pretty clear that strict gun laws don't create a "safer" state.

What is blurring the picture of your data is the city-level data:

Gunrates_zpsf79a6331.jpg


New Orleans, St Louis, Miami, and Richmond are all in the permissive states. The anti's like to point to these states as proof that we need more gun control. Looks like your data will refute that though. Keep up the good work.

It would be good to figure out how to control for the effect of the cities...

Source: http://www.theatlanticcities.com/neighborhoods/2012/12/geography-us-gun-violence/4171/
 
Back
Top