Generally, lower SD and ES mean more consistent performance, but that doesn't always translate to smaller groups. Too many other factors are involved.
Are low SD and ES worth chasing? Statistics estimate parameters. Much more sensible than just blindly working to improve the SD and ES is to figure out what you actually need, gather some data from shooting, and then apply statistics to your measured results to estimate the odds of successfully meeting your needs with it. That will help you decide if it's worth the chase.
The effect of velocity variation alone on rifle precision is tough to predict for real guns. A ballistics program will tell you the effect it will have for shots fired out of a perfect barrel that is perfectly rigid, but none of us has one of those. We tune rifle loads to land on a muzzle deflection phase that narrows our groups. That can closely mimic a rigid barrel's performance, but it is also theoretically possible to achieve a mean barrel time such that your faster loads exit with the muzzle just slightly below where it is when your slower shots exit, and in that way, can produce a range of distances over which the stringing from velocity variation is reduced from what the ballistics software predicts.
Handgun barrels are generally short enough and have small enough moments of inertia to be too rigid to exhibit the bending behavior you see in rifle barrels.
As mentioned in an earlier post, SD, the sample standard deviation, is an estimate of sigma (σ), the population standard deviation. For a load, the population is all the copies of it you have ever fired and ever will fire in your shooting system. The closer the sample size gets to population size, the closer the SD estimate gets to σ.
ES and σ are correlated, but the correlation changes with group size, and ES varies from sample to sample even when σ doesn't, so converting from σ to ES only tells you what the average result would be. If I convert SD to ES, I am really using an estimate of σ to find what the average ES for my sample size is expected to be, assuming that the estimate of σ was dead on, so now I've got a sample-to-sample variation on both ends. So, the conversions have quite a bit of their own variation, and I have to accept there is some amount of error.
SD better represents your shooting system performance as the sample size grows. ES represents it less well as the sample size grows. Why? Each additional sample gives SD another building block for its estimate of σ. But each additional sample also gives improbable extreme shots another chance to occur. In other words, if you fire a three-shot group, the odds of a one-in-a-thousand outlier value appearing are small. But if you fire a 1000-shot group, the odds of that one-in-a-thousand outlier value appearing are much higher. The SD calculation method dilutes the influence of outliers on the result, while measured ES gives it full weight.
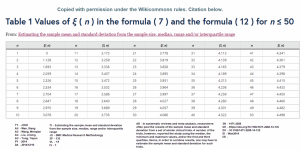
How are SE and SD correlated? While outliers can occur to ES that don't have a proportional effect on SD, the average value of SE over many groups has a reliable relationship to SD that is unique for each sample size. The statistic that makes the conversion is called zye of
n, symbolized as
ξ")
.
To get SD from ES, divide ES by
ξ for your sample size.
To get ES from SD, multiply SD by the value of
ξ for your sample size.
Here is a table of values for
ξ for different sample sizes:

")