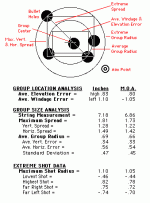
This is what I meant if I didn't explain myself very well. The larger square is how I measure my groups, if I measure them at all.
This is somewhat similar to the procedure that I developed some years ago. The standard "group size" procedure, i.e., maximum spread, is statistically unsatisfying because you can never make the group smaller with additional shots, even if all those shots go through the same hole - one flyer can determine the group size, so all the information provided by those other shots is, in effect, wasted. There is a much better way.
I put all shots taken in a string into a standard x,y coordinate system where the aiming point is 0,0. Shots in the upper right quadrant are therefore +x,+y, lower right are +x-y, and so forth. It's then a simple matter to calculate the group center (which is the average x and average y), and then, using the good old Pythagorean Theorem, to calculate the distance that each shot is from that center. Averaging the individual deviations then gives you a measure of how "off" a typical shot is from the group center, which is a much more useful measure of precision than maximum spread. It's also possible for additional shots in a string to result in a smaller average deviation, which is as it should be.
This all happens on an Excel spreadsheet and is pretty straightforward, though it does take a bit of time to get the coordinates for each shot (much quicker since I got a pair of digital calipers). The same spreadsheet also calculates the distance between all pairs of shots and then selects the largest, providing the standard "maximum spread" measure for comparison.

