I've put together a number of plots that some may find useful.
How to use the plots.
The plots come in pairs. Each pair assumes at least a particular number of hits required for "success". The number of hits required for "success" ranges from 1 to 6 so there are a total of 12 plots. Although the plots are labeled with: "Success = X Hits" it would probably be more accurate for the labels to say: "Success = At Least X Hits" or maybe: "Success = X Or More Hits"
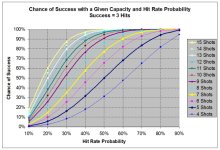
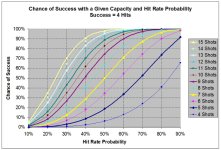
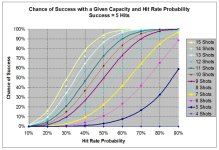
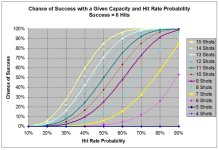
If the plot has "Hit Rate Probability" along the bottom of the graph, then each colored line on the plot represents the range of probabilities of success for a given capacity from 4 shots to 15 shots. Note that the lines on the plots are in the same vertical order as the legend on the right of the plot. You can pick a line representing a particular capacity and trace it across the graph to see how different hit rate probabilities will affect the chances of success for that capacity.
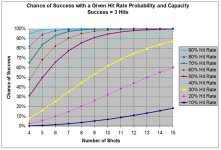
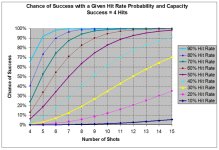
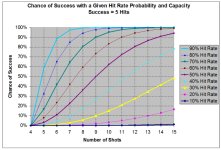
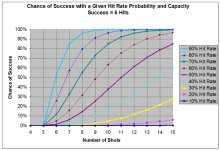
If the plot has "Number of Shots" along the bottom of the graph, then each colored line on the plot represents a range of probabilities of success for a given hit rate ranging from 10% to 90%. Note that the lines on the plots are in the same vertical order as the legend on the right of the plot. You can pick a line representing a hit rate probability and trace it across the graph to see how different capacities will affect the chances of success for that hit rate.
You can also use the plots to find the chance of success for a specific set of assumptions.
Example:
To find the probability of hitting a target at least 2 times (2 or more times) out of 8 shots with a hit rate of 50%, first find the pair of plots which are labeled "Success = 2 Hits". If you pick the plot that has "Number of Shots" across the bottom, then find where the axis is labeled 8 and trace the gridline up to where it crosses the "50% Hit Rate" line. If you pick the plot that has "Hit Rate Probability" along the bottom of the graph, then find where the bottom axis is labeled 50% and trace the gridline upward to where it crosses the "8 Shots" line. In either case, read the probability of success off the axis on the left.
The range of hits required to achieve success (1-6) is designed to cover what a person might reasonably be expected to require to solve a self-defense encounter. Might it take more or less? Of course. But going less than one doesn't make sense and making the graphs takes time so I stopped at six. If someone is really concerned about the probability for a scenario requiring more than six hits, PM me and I'll run a special case for you.
Be reasonable when you choose your hit rates if you expect to get reasonable results. There may be some of us who could really be expected to hit 80 or 90% of our shots during a gunfight, but the outcomes of real world scenarios suggest that the number is probably considerably lower. I recall reading the analysis of one study that examined a large number of police shootings which indicated that the average hit rate in a gunfight was about 3 hits for every 10 shots fired.
The graphs do not provide "high fidelity gunfight simulation numbers". They provide probabilities that are calculated based on three very simple assumptions. No more, no less. The graphs are not based on real world data or statistics, they are simply the results of probability calculations with three inputs. They can not, nor are they intended to predict the outcome of gunfights. They provide the calculated probability of "success" given an assumed hit rate probability, an assumed number of required hits for success and an assumed number of shots/capacity.
It's best to think of them as sort of "best case scenario" probabilities. The probabilities in the real world won't be better than the graphs show for a given hit rate, capacity and required number of hits, but they could easily be worse.
Here are a few ways how that could be true.
1. You get shot before you can finish firing all your rounds.
2. You fixate on one attacker and end up "wasting rounds" on him even after he's been neutralized with the required number of hits.
3. Your gun jams before you can finish firing all your rounds.
4. You never get a chance to draw and fire.
The probabilities are about finding a proper balance.
Moving up in capacity obviously improves your odds of making the required number of hits before running dry, but you can't get carried away in that direction because it's not terribly likely that a person will be able to take advantage of a huge round count in the few seconds a gunfight typically lasts.
Improving the hit rate probability (sharpening shooting skills) clearly helps a lot, but even so, if you need to make more than just a couple of hits, you still need some capacity available to take advantage of that skill. And, practically speaking, there's a limit to how much we can improve our shooting ability.
I've posted on this topic before but this is the first time I've provided such a full range of plots.
Here's one discussion of this general topic. In that thread, I only ran one pair of graphs focused on requiring at least 4 hits as the definition of success. But there's a lot of worthwhile (as well as some not so worthwhile) discussion about what the numbers do and don't mean.
https://thefiringline.com/forums/showthread.php?t=494257
The graphs can also be useful to counter the argument that no honest person needs more than a small number of rounds for effective self-defense.
Here's another thread where some of the concepts relating to the graphs and their probabilities were discussed.
https://thefiringline.com/forums/showthread.php?t=589112
And now, without further ado, here are the graphs.
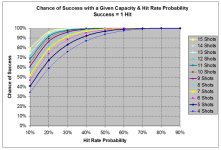
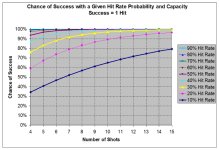
The following two plots show how capacity and hit rate probability affect the chance of success if success is defined as scoring at least one hit (one or more hits). Note that with the higher hit rates and capacities, the probabilities compress to the top of the graph, meaning that success is very likely.


How to use the plots.
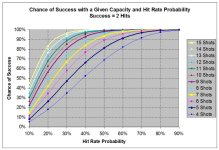
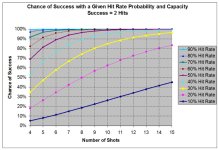
The plots come in pairs. Each pair assumes at least a particular number of hits required for "success". The number of hits required for "success" ranges from 1 to 6 so there are a total of 12 plots. Although the plots are labeled with: "Success = X Hits" it would probably be more accurate for the labels to say: "Success = At Least X Hits" or maybe: "Success = X Or More Hits"
If the plot has "Hit Rate Probability" along the bottom of the graph, then each colored line on the plot represents the range of probabilities of success for a given capacity from 4 shots to 15 shots. Note that the lines on the plots are in the same vertical order as the legend on the right of the plot. You can pick a line representing a particular capacity and trace it across the graph to see how different hit rate probabilities will affect the chances of success for that capacity.
If the plot has "Number of Shots" along the bottom of the graph, then each colored line on the plot represents a range of probabilities of success for a given hit rate ranging from 10% to 90%. Note that the lines on the plots are in the same vertical order as the legend on the right of the plot. You can pick a line representing a hit rate probability and trace it across the graph to see how different capacities will affect the chances of success for that hit rate.
You can also use the plots to find the chance of success for a specific set of assumptions.
Example:
To find the probability of hitting a target at least 2 times (2 or more times) out of 8 shots with a hit rate of 50%, first find the pair of plots which are labeled "Success = 2 Hits". If you pick the plot that has "Number of Shots" across the bottom, then find where the axis is labeled 8 and trace the gridline up to where it crosses the "50% Hit Rate" line. If you pick the plot that has "Hit Rate Probability" along the bottom of the graph, then find where the bottom axis is labeled 50% and trace the gridline upward to where it crosses the "8 Shots" line. In either case, read the probability of success off the axis on the left.
The range of hits required to achieve success (1-6) is designed to cover what a person might reasonably be expected to require to solve a self-defense encounter. Might it take more or less? Of course. But going less than one doesn't make sense and making the graphs takes time so I stopped at six. If someone is really concerned about the probability for a scenario requiring more than six hits, PM me and I'll run a special case for you.
Be reasonable when you choose your hit rates if you expect to get reasonable results. There may be some of us who could really be expected to hit 80 or 90% of our shots during a gunfight, but the outcomes of real world scenarios suggest that the number is probably considerably lower. I recall reading the analysis of one study that examined a large number of police shootings which indicated that the average hit rate in a gunfight was about 3 hits for every 10 shots fired.
The graphs do not provide "high fidelity gunfight simulation numbers". They provide probabilities that are calculated based on three very simple assumptions. No more, no less. The graphs are not based on real world data or statistics, they are simply the results of probability calculations with three inputs. They can not, nor are they intended to predict the outcome of gunfights. They provide the calculated probability of "success" given an assumed hit rate probability, an assumed number of required hits for success and an assumed number of shots/capacity.
It's best to think of them as sort of "best case scenario" probabilities. The probabilities in the real world won't be better than the graphs show for a given hit rate, capacity and required number of hits, but they could easily be worse.
Here are a few ways how that could be true.
1. You get shot before you can finish firing all your rounds.
2. You fixate on one attacker and end up "wasting rounds" on him even after he's been neutralized with the required number of hits.
3. Your gun jams before you can finish firing all your rounds.
4. You never get a chance to draw and fire.
The probabilities are about finding a proper balance.
Moving up in capacity obviously improves your odds of making the required number of hits before running dry, but you can't get carried away in that direction because it's not terribly likely that a person will be able to take advantage of a huge round count in the few seconds a gunfight typically lasts.
Improving the hit rate probability (sharpening shooting skills) clearly helps a lot, but even so, if you need to make more than just a couple of hits, you still need some capacity available to take advantage of that skill. And, practically speaking, there's a limit to how much we can improve our shooting ability.
I've posted on this topic before but this is the first time I've provided such a full range of plots.
Here's one discussion of this general topic. In that thread, I only ran one pair of graphs focused on requiring at least 4 hits as the definition of success. But there's a lot of worthwhile (as well as some not so worthwhile) discussion about what the numbers do and don't mean.
https://thefiringline.com/forums/showthread.php?t=494257
The graphs can also be useful to counter the argument that no honest person needs more than a small number of rounds for effective self-defense.
Here's another thread where some of the concepts relating to the graphs and their probabilities were discussed.
https://thefiringline.com/forums/showthread.php?t=589112
And now, without further ado, here are the graphs.
The following two plots show how capacity and hit rate probability affect the chance of success if success is defined as scoring at least one hit (one or more hits). Note that with the higher hit rates and capacities, the probabilities compress to the top of the graph, meaning that success is very likely.
")